[ad_1]
 A customer at the Ambience Mall in Gurgaon, Haryana (Express Photo by Tashi Tobgyal)
Dear Readers,
The past week has thrown up some heartening news on the economic front.
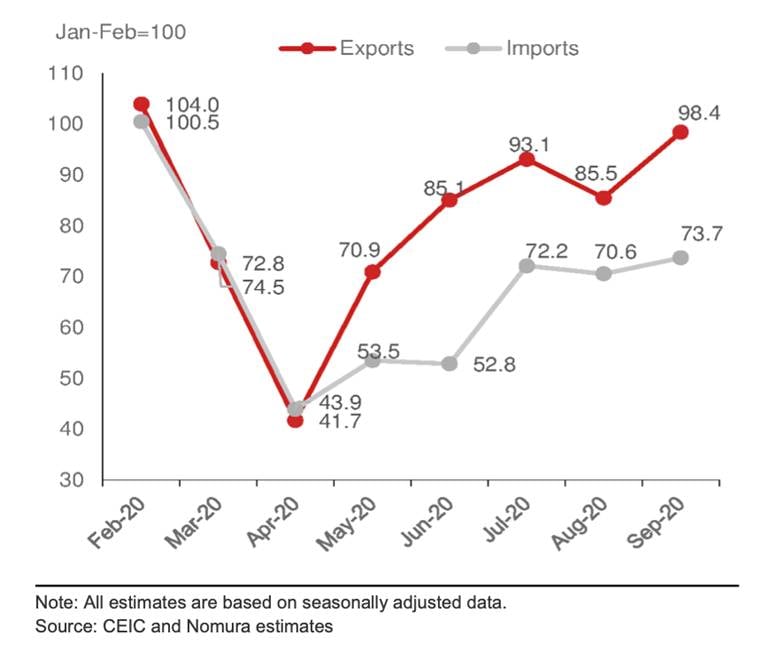
First up, after contracting for six months on the trot, India’s exports staged a turnaround and grew in September. The pace of growth was marginal at 5.27% but under the circumstances, any growth is a cheerful development. However, imports declined by close to 20% and that is typically bad news for a growing economy.
As this chart below on the level of trade normalisation shows, exports have returned to 98.4% of normal in September, while imports have risen at a slower pace to 73.7% of normal.
 Source: CEIC and Nomura estimates
Then there was optimistic news from the crucial automobile sector. Maruti Suzuki registered a 34% jump in sales in September — selling the most number of cars in a month in the past two years. It was not the only company to improve. Hyundai (24%), Honda (10%) and Mahindra & Mahindra (3.5%) — all saw positive growth even though some such as Toyota (minus 20%) missed out. Two-wheelers, led by Hero MotoCorp, also saw health sales.
The hopes of robust sales during the forthcoming festive season is the likely driver for these purchases as dealers stock up. Given the shape of the economy, it is hardly surprising that the focus of such sales is at the lower end of passenger cars and also in rural areas.
An allied improvement was in the demand for petrol, which grew by 2% over September last year, and rose for the first time since the nationwide lockdown was announced in later March. Consumption of diesel, however, registered a fall year-on-year (that is, in September this year compared to September 2019).
There seems to be more demand for personal mobility and less for community mobility, and this is showing up both in the demand for the type of fuel and the type of cars. For instance, jet fuel sales in September were down 54%, year-on-year.
📣 Express Explained is now on Telegram. Click here to join our channel (@ieexplained) and stay updated with the latest
But possibly the biggest bit of news was the sharp spike in the Nikkei Manufacturing Purchasing Managers’ Index. This index, which is compiled by IHS Markit and is seen as a proxy for factory-level activity, jumped to 56.8 in September from 52.0 in August. Anything above the 50-level in this index implies growth; anything below 50 implies contraction. According to Reuters, the index registered its highest reading since January 2012.
All this news in September is in stark contrast to August, which saw the output of India’s eight core sectors of infrastructure decline by almost 9%. What made this decline worse is the fact that it was in comparison to the non-existent growth in August 2019.
The obvious questions then are: Has the Indian economy decidedly staged a turnaround? Is the worst over?
Well, if one looks at September, one might be tempted to arrive at that conclusion. But the age-old wisdom is that one swallow doesn’t make a summer.
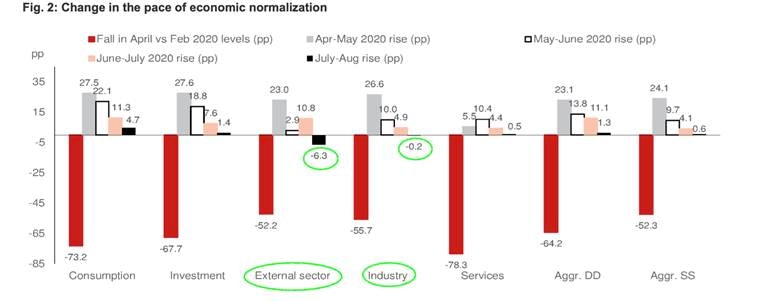
Look, for instance, at what happened when India opened up after the nationwide lockdown in late March and April. The chart below (Source: Nomura), showing the pace of economic normalisation, brings out the essential point: That the rate of improvement in economic activity decelerated with each passing month from May to August.
 Source: Nomura
In fact, in some sectors of the economy, such as External (that is, exports, foreign visitors etc.) and Industry (that is, cement, steel etc.), the rate of improvement was turned negative in August — look at the green highlights in the chart above.
Typically, one would have expected that as the country opened up more and more, the pace of economic normalisation would have increased and quickly attained its overall potential.
Yet, according to this index by Nomura economists Sonal Varma and Aurodeep Nandi, as of August, aggregate demand was still less than 70% of potential and aggregate supply was slightly better at 85.7%.
Moreover, according to some, even as September ended, economic activity was beginning to stagnate yet again.
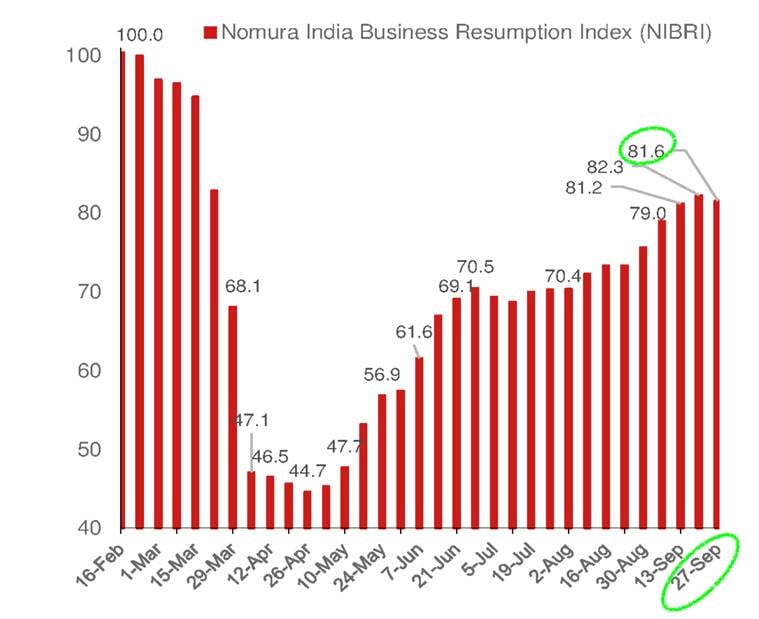
For instance, Nomura India Business Resumption Index (NIBRI), shown in the chart below, combines inputs from Google mobility indices, driving mobility from Apple, power demand and the labour force participation rate to prepare a weekly tracker of economic activity normalisation. The Chart shows a distinct improvement in September. But note the dip for the week ending September 27.
 Nomura India Business Resumption Index (NIBRI)
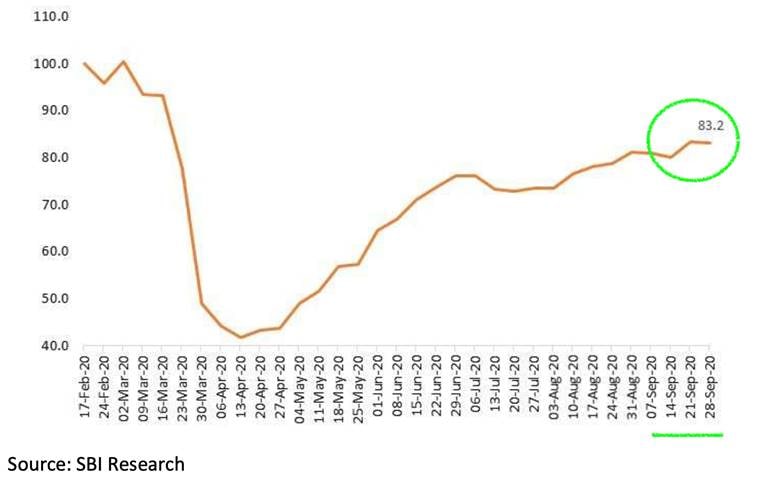
Another example is the SBI Business Activity Index. As shown in the chart below, highlighted in green, economic activity jumped up in early September but then stagnated towards the end.
 Source: SBI Research
In other words, even if September shows a lot of promise, one should wait before jumping to a conclusion.
Stay safe!
Udit
📣 The Indian Express is now on Telegram. Click here to join our channel (@indianexpress) and stay updated with the latest headlines
For all the latest Explained News, download Indian Express App.
© IE Online Media Services Pvt Ltd
[ad_2]
Source link