
[ad_1]
Summary
- The equity market seems to be under a sentiment splash with many major indices such as S&P/ASX 200, S&P/ASX A-REIT, S&P/ASX All Small Ordinaries, posting some strong recovery.
- While these indices are showing an upside momentum, the technology sector is not lagging being with the S&P/ASX All Technology Index posting a price appreciation of ~ 112 per cent.
- The technology index has now reached a record value, which is further raising some eyebrows on how sustainable this rally could get or is there any steam left?
- Within the technology index, the heavyweights such as Afterpay Limited have also reached a record value in the recent past.
- However, the table now seems to be turning on charts.
The technology space seems to be capturing the attention of the investing community with the S&P/ASX All Technology Index reaching to a record value of 2,415.10 (as on 20 August 2020).
Also Read: S&P/ASX 200 A- REIT Attempts Volatility Breakout – GMG, CHC, and DXS
The S&P/ASX All Technology Index has delivered a YTD return of 20.16 per cent (as per 19 August 2020 closing) and a one year return of 33.05 per cent with a price appreciation of ~ 112.35 per cent from the level of 1,137.30 (intraday low on 23 March 2020) to the present high.
The surge in the S&P/ASX All Technology Index is well supported by its major constituent such as Afterpay Limited (ASX:APT), which is also hitting a record high.
Also Read: How Sustainable Is the Recovery of BNPL Stocks – APT and PPH?
S&P/ASX All Technology Index on Charts
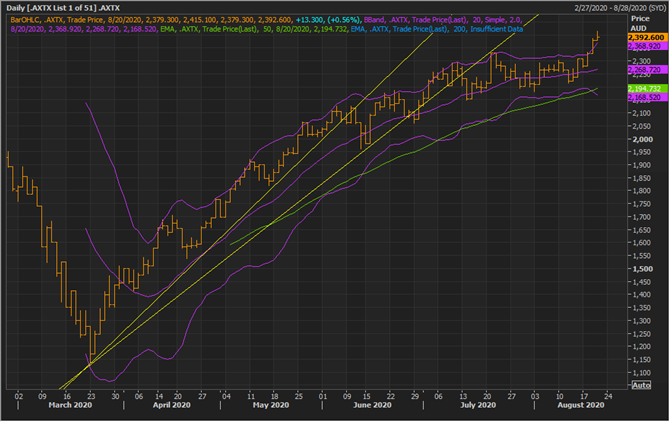
S&P/ASX All Technology Index Daily Chart (Source: Refinitiv Eikon Thomson Reuters)
On the daily chart, it could be seen that the index is on a continuous rise after a deep correction in March 2020. During the initial phase of the recovery, the index rose steeply and then reduced the relative steepness later.
The index has breached its support zone, which should now act as the resistance zone for the index.
- Furthermore, the index has now attempted a volatility breakout with prices breaching the +2 Standard Deviation of the 20-day simple Bollinger band, which is now pending confirmation.
- In the forward-looking context, if the index now sustains and confirms the volatility breakout, it could rise to test the resistance zone, i.e., the area between the projected trendlines.
- Also, it should be noticed that the confirmation signal varies from traders to traders, and for the purpose of confirmation one ideal signal could be two consecutive daily close followed by a weekly close above the +2 Standard Deviation of the 20-day simple Bollinger band.
- At present, the index is trading above its 50-day exponential moving average, which is now overlapping with the -2 Standard Deviation of the Bollinger band, suggesting that the short-term trend is positive in nature.
- Also, the -2 Standard Deviation should act as a decisive support for the index in the immediate future.
Technology Heavy Weights Under Sentiment Splash
Afterpay Limited (ASX:APT)
APT on a Daily Chart
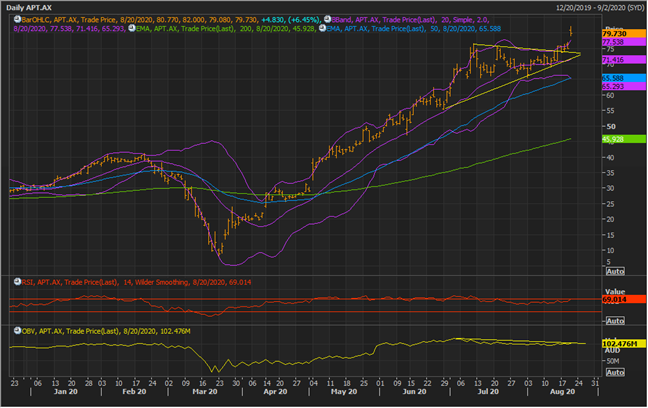
APT Daily Chart (Source: Refinitiv Eikon Thomson Reuters)
On a daily chart, it could be seen that the APT is forming a potential pennant on with a considerable large flagpole. In the recent past, the stock has breached the upper line of the pennant; however, now the stock is also developing another angle.
The stock has been in a consistent rally from the mid-March 2020 and has now reached a record high.
- At present, the stock is trading above the 50-day exponential and 200-day exponential moving averages, suggesting that the primary trend in the stock is an uptrend.
- Also, during the trading session on 20 August 2020, the stock has witnessed a gap up trading session to achieve a volatility breakout with prices crossing above the +2 Standard Deviation of the Bollinger band.
- The recent surge in the stock, the breakout of a pennant, followed by a volatility breakout, clearly reflects that bullish sentiments currently dominate the front.
- However, while the stock is now at the top, few signals are emerging, which might be reflecting towards a potential correction in the stock.
- First, the recent price surge in the stock is showing a divergence with the On Balance Volume, reflecting the tiredness of bulls to keep the rally consistent.
- Apart from that, the trading session on the top has been losing momentum with the distance between the low and high relatively closing-in.
- Also, while the volume is under a decline and the price is on a surge, the stock has witnessed an exhaustion gap, which is still pending confirmation.
- In the forward-looking context, if the stock retraces back to cover the recent gap swiftly, fit would confirm the emergence of the exhaustion gap, which could be an early sign of a correction.
- Also, the 14-day Relative Strength Index is showing a divergence with the price action with the stock inking a new high while the RSI is failing to do so, suggesting that the current rally is losing strength.
If the price corrects anytime in the near future, the upper line of the pennant should act as support followed by the bottom line of the pennant which is overlapping with the mean value of the 20-day simple Bollinger band.
Xero Limited (ASX:XRO)
XRO on a Daily Chart
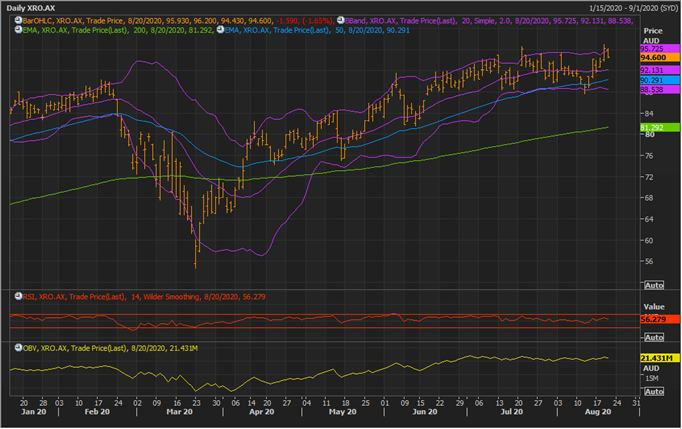
XRO Daily Chart (Source: Refinitiv Eikon Thomson Reuters)
On following the daily chart, it could be seen that the stock is moving in an uptrend with its price trading above the 50-day exponential moving average and 200-day exponential moving average.
- During the trading session on 19 August 2020, XRO attempted a volatility breakout with the stock breaching the +2 Standard Deviation of the 20-day simple Bollinger band.
- However, the stock failed to sustain the breakout and fell again during the day’s session on 20 August 2020.
- The stock is somewhat showing the same price behaviour as compared to its peer – APT with the both the 14-day RSI and On Balance Volume, showing divergence with the price action, reflecting the tiredness of bulls to keep the stock under consistent rally.
- In the forward-looking context, if the stock corrects, the mean value of the 20-day simple Bollinger band should act as immediate support for the stock, followed by the -2 Standard Deviation, which should act as a decisive support for the stock as it is overlapping with the 50-day exponential moving average.
In a nutshell, while the major underlying stock of technology stocks, i.e., the S&P/ASX All Technology Index is attempting a volatility breakout to test the long-term trendline projected resistance zone, the heavyweights are showing some early signs of a correction, which once confirm themselves, could give some tough time to the index in breaching its resistance zone ahead.
[ad_2]
Source link